Historical chart prices can change after a split or a dividend adjustment. A data provider restates the earlier series on a comparable basis. This does not mean an exchange changed the price of your past trade. An adjusted chart and a record of actual executions answer different questions.
Why a split looks like a fall
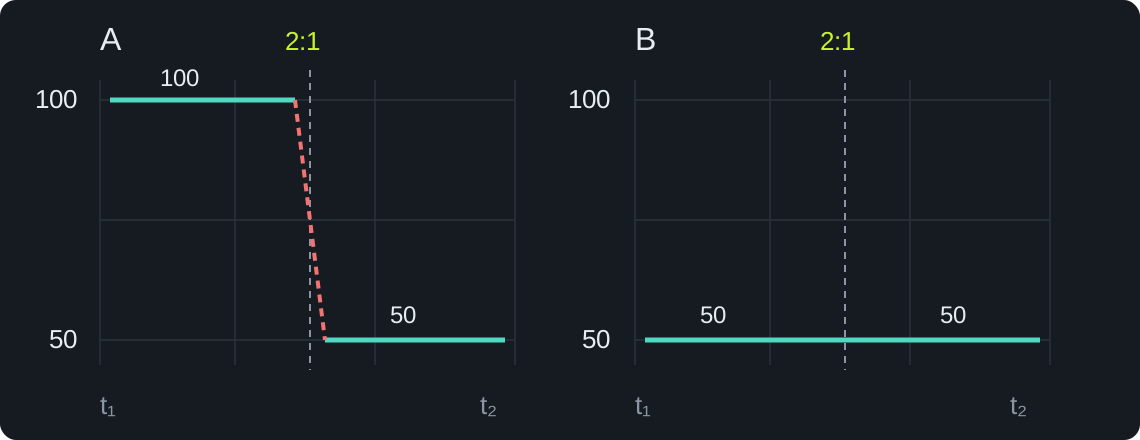
Consider a hypothetical share priced at 100 before a 2-for-1 split. It becomes two shares priced at 50 each. Other things equal, the position is still worth 100. The split itself does not produce a 50% loss: the share count and price unit change. TradingView explains the mechanics of splits.
In the original series, 100 → 50 can resemble a crash. To compare with the period after the split, earlier prices are divided by two: the old 100 appears as 50. If share volume is adjusted as well, its units are changed in the opposite direction.
What a dividend adjustment changes
A dividend transfers some company funds to shareholders. The price may fall on the ex-dividend date, when shares begin trading without entitlement to the distribution. The actual move also depends on the market; it need not exactly equal the dividend. Investor.gov, the SEC's educational resource, explains the dates and entitlement.
Another hypothetical example: the last close is 100 and the cash dividend is 2. One way to align the series is to multiply earlier prices by (100 − 2) / 100 = 0.98. The old close becomes 98. This is a presentation method, not a claim that an actual trade at 100 occurred at 98.
A dividend-adjusted history helps account for distributions when comparing performance. It is not automatically your account return after taxes, fees and reinvestment assumptions. StockCharts documents its adjustment method, including the differences between price series.
Why levels and annotations differ
A level of 100 on an old screenshot cannot be carried unchanged onto a series in which that earlier segment has been divided by two. Absolute pivot values and the appearance of a gap at the event boundary may change. An indicator using a different series may also show a different picture.
A common multiplier does preserve price ratios within the segment to which it applies. Therefore, adjustment is not an automatic explanation for every disagreement between annotations: compare the underlying data.
Another trap is an Adjusted Close column next to ordinary Open, High and Low. Do not assume all four fields use the same adjustment unless the provider says so. Even “unadjusted” can mean different things across services.
What to compare first
- The instrument, provider, trading session and timeframe.
- Whether splits, dividends and other corporate actions are included.
- Whether all OHLC fields use one basis, rather than Close alone.
- The snapshot date and the version of history used.
An examination of historical execution prices needs the relevant trade records. A comparison of long histories needs an explicitly stated adjustment basis. A historical test must also consider when data became available: today's restated series does not prove that a participant saw that same series in the past.