A linear scale assigns equal distances to equal price differences. A logarithmic price scale assigns equal distances to equal price ratios. Time commonly stays linear, making the chart semi-logarithmic.
Equal differences
Both 10 → 20 and 100 → 110 add 10 price units and have equal height on a linear scale. Their relative changes are +100% and +10%.
A linear scale is useful for absolute levels and differences. It is not inherently incorrect.
Equal ratios
Both 10 → 20 and 100 → 200 double the price. They have equal height on a logarithmic scale because log(20/10)=log(200/100). Likewise, 100 → 110 and 200 → 220 both gain 10%.
The logarithm base changes axis units, not this property. A 50% rise and 50% fall do not cancel: 100 → 150 → 75. Returning from 150 to 100 requires a one-third decline.
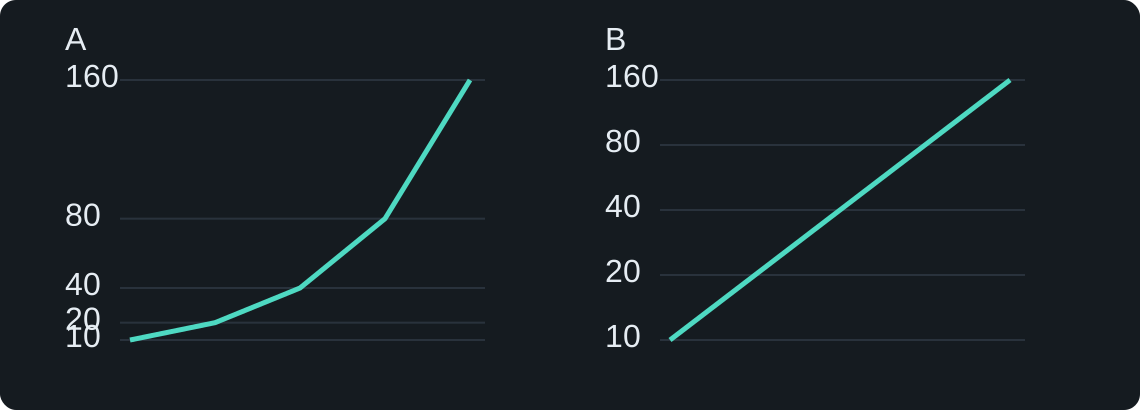
Why lines differ
A straight line on a linear chart represents constant absolute change per time unit. On a logarithmic chart it represents a constant relative growth rate. Slopes, apparent symmetry and intersections with drawn lines can therefore differ.
The scale does not change original OHLC values or remove price-rule violations. State how proportions are measured, especially across long histories.
Limitations
Ordinary logarithms are undefined for zero and negative prices. Such values need another representation, not silent removal. Log differences are not exactly simple percentage returns, although they are close for small changes.
See TradingView’s official chart-scale explanation. Choosing a suitable scale improves comparison; it does not automatically improve predictive accuracy.