Phases A–E describe development from stopping the previous movement to leaving a trading range. A phase is part of a process; SC, spring or SOS are individual events that may inform its interpretation.
Five different tasks
| Phase | Accumulation | Distribution |
|---|---|---|
| A | Stop the previous decline; establish initial boundaries | Stop the previous advance; establish initial boundaries |
| B | Range fluctuations and an inferred cause | Range fluctuations and inferred distribution |
| C | Test supply; a spring is possible | Test demand; UTAD is possible |
| D | Upward progress showing strength, with more subdued reactions | Downward progress with weak recoveries |
| E | Movement develops outside the range upward | Movement develops outside the range downward |
This is a teaching model, not a mandatory algorithm for every market.
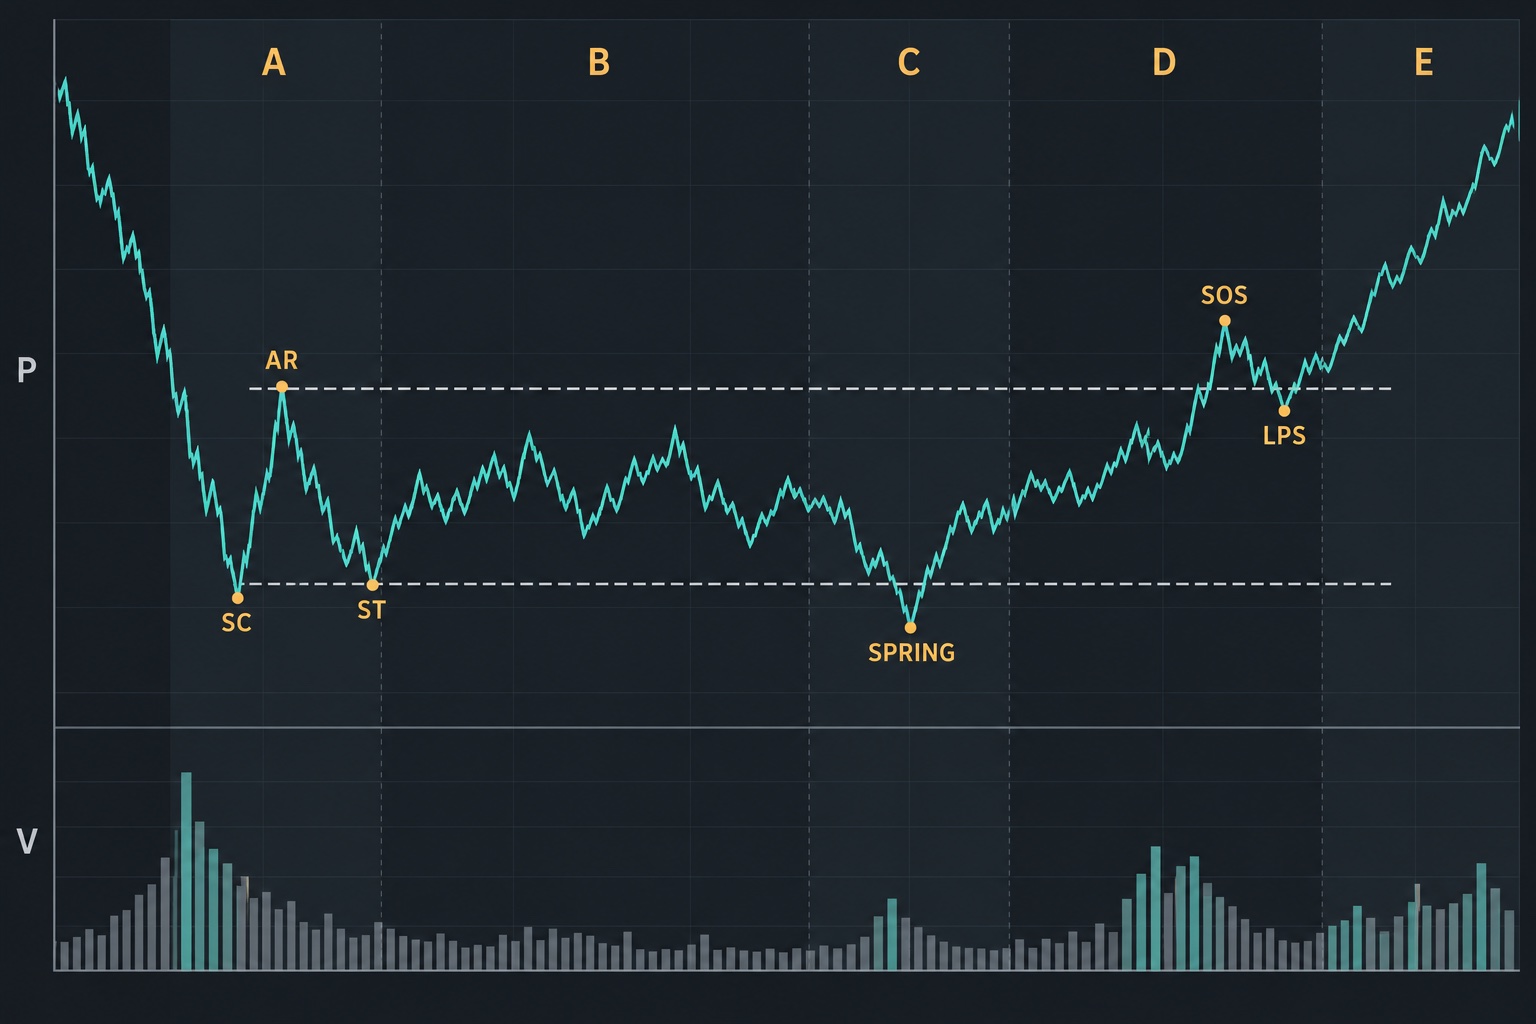
C is not synonymous with a penetration
Springs and UTADs are conspicuous but optional. Tests may occur inside the range. Their absence does not exclude the hypothesis, and their presence does not prove it.
Phase D requires a more persistent change across movements, not a single candle. The D/E boundary may become clearer only after sufficient progress and holding outside the range.
Unequal duration
B may be much longer than other phases. Stops can be diffuse, tests repeated and attempted exits reversed. Do not divide history into five equal pieces or force every segment into a neat label.
Another range may develop at a different scale. Matching letters at two scales do not imply one identical process.
Avoid retrospective certainty
Record information available on the date and mark provisional phases. Specify later observations compatible with the hypothesis and those contradicting it. Identify retrospective diagrams when the continuation is already known.
See ChartSchool and the article on look-ahead bias.