Accumulation in the Wyckoff model is an inferred transfer toward participants willing to hold an asset, after a decline or during an uptrend pause. A chart shows price and volume changes, not ownership records. The process label remains an interpretation.
From a stopped decline to a range
SC, selling climax, describes a climactic selling episode. AR, automatic rally, is the following rebound. ST, secondary test, revisits the earlier low area to assess supply.
Together they help outline a working range. One high-volume falling candle does not establish that the decline has ended. A stopping process may also lack an obvious climax.
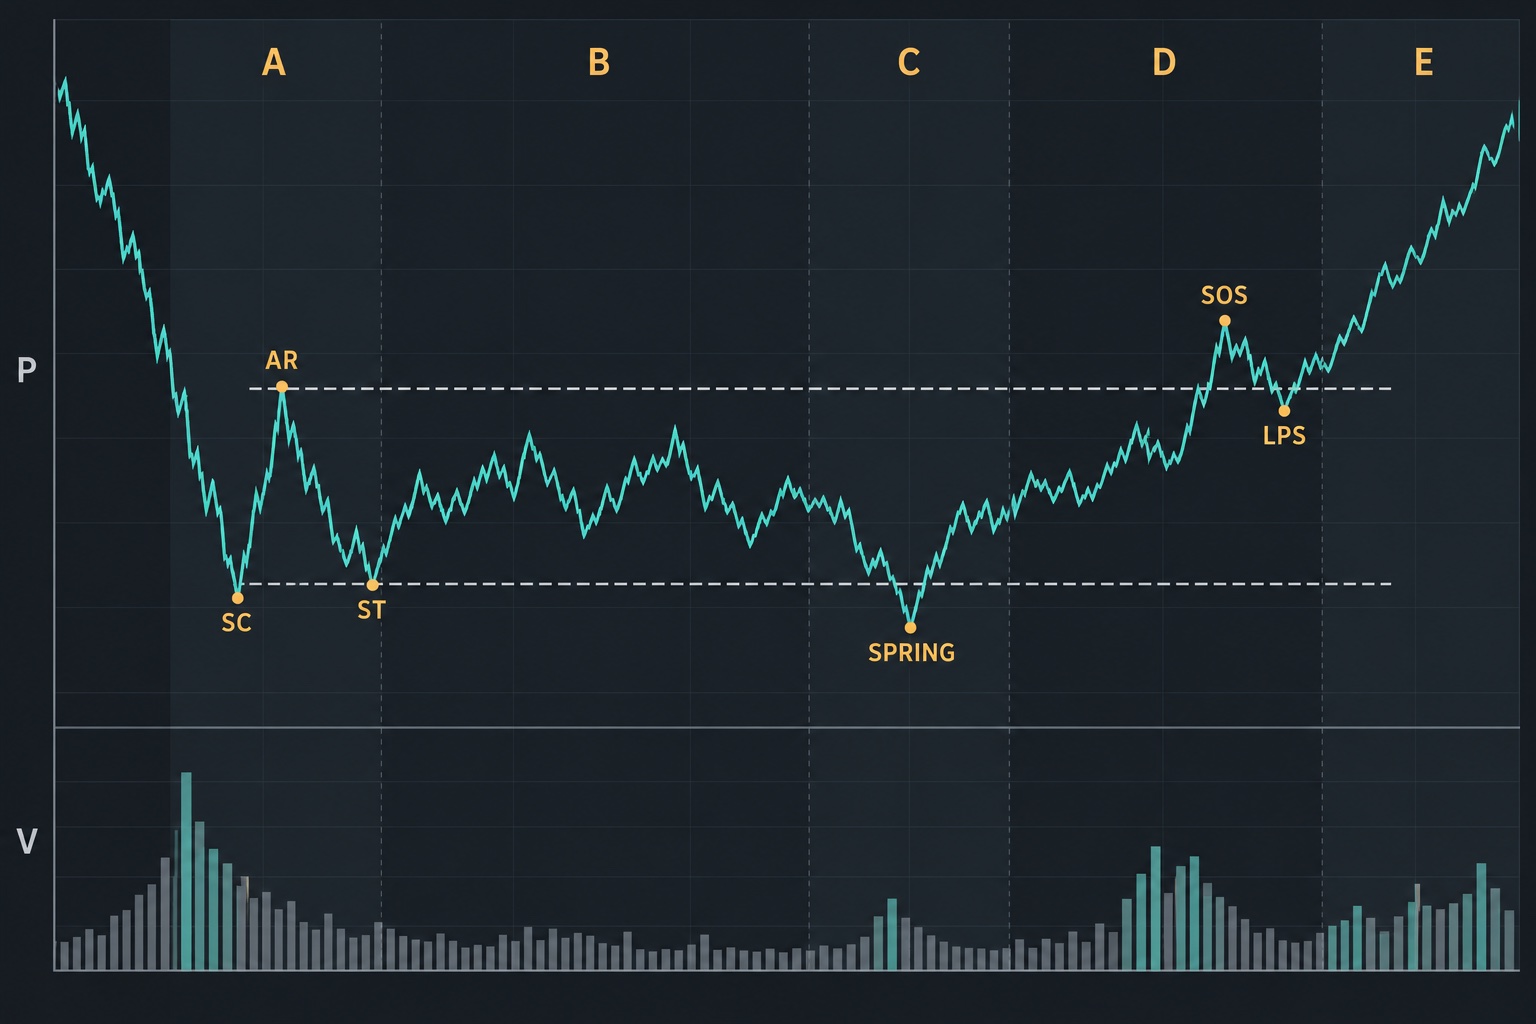
Hypothetical sequence
After falling from 130 to 100, price rebounds to 110 and oscillates between those levels. Later a low of 98 is followed by a return and close at 102. This is a spring candidate, not proof of completed accumulation.
Progress to 112, holding around 110 on a reaction and more subdued reaction activity add context for SOS and LPS. These invented prices describe one teaching sequence, not a mandatory continuation.
Evidence against the interpretation
Sustained trading below support, poor progress after rebounds and increasing activity on renewed declines weaken the accumulation hypothesis. The range may be a pause before further markdown.
A spring is optional: supply testing can occur above the range low. Do not invent a penetration to match the diagram.
Range versus accumulation
A range describes bounded price movement. Accumulation explains it through an event sequence and comparative volume behaviour. The explanation needs more evidence than two horizontal lines.
Terminology: ChartSchool. Continue with phases A–E.