SOS (Sign of Strength) describes upward progress, commonly with wider bars and relatively greater activity. Assess it against the preceding range and earlier movements.
Progress, not volume alone
High volume without further upward progress is not equivalent to SOS. Compare effort with result: closing position, distance travelled and ability to retain the achieved area.
SOS may develop toward and through the range’s upper boundary. Do not reduce it to one candle crossing a horizontal line.
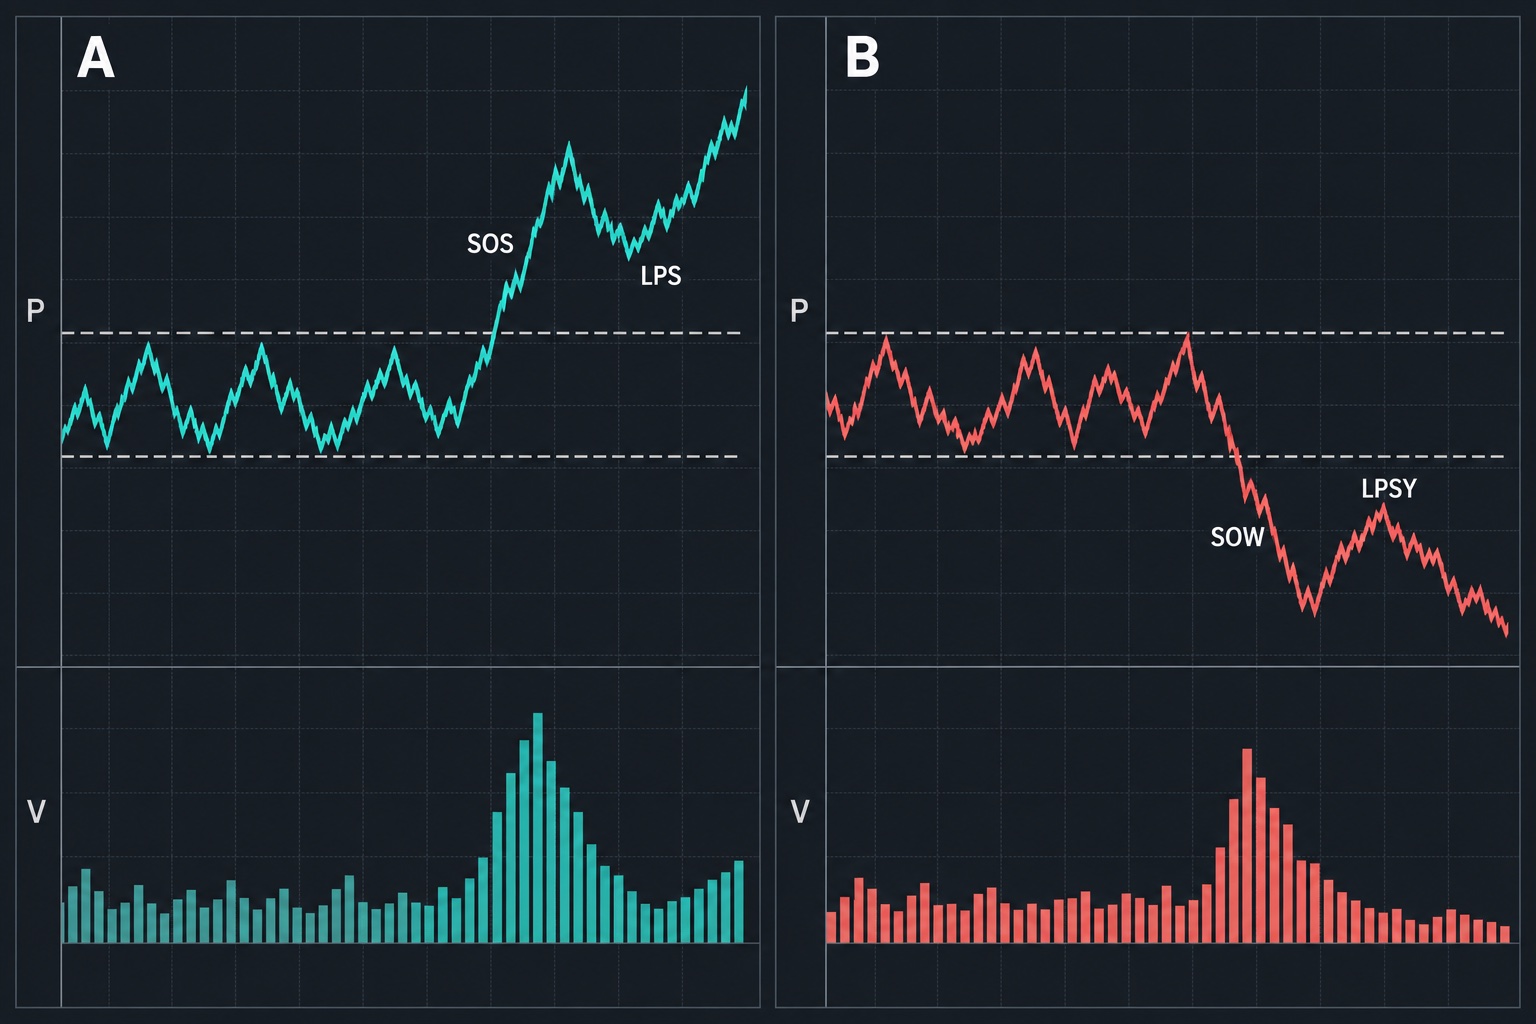
Hypothetical example
In a 100–110 range, previous advances stopped around 108. A sequence reaches 112 with wider bars than earlier rallies. This supports discussing strength at the chosen scale.
A substantially smaller reaction and holding around former resistance add context for LPS. These invented prices are not entry rules.
Counterexample
A single move to 112 followed by a quick return to 103 does not establish sustained demand dominance. Describe the attempted progress and its unsuccessful follow-through separately. An SOS label must not conceal subsequent weakness.
Higher volume may also reflect news, an auction or source characteristics. A bar does not identify the cause of activity.
Description is not prediction
SOS describes observed strength. It sets no target and does not require the next bar to rise. Testing a trading claim requires independent observations and costs.
Terminology: ChartSchool. Compare SOW.