LPS (Last Point of Support) identifies the low area of a reaction after strength in inferred accumulation. It should not label any local low without preceding context.
SOS before the reaction
Compare the advance with its reaction: bar ranges, depth, closes and relative volume. More subdued ranges and activity are compatible with reduced supply.
“Last” does not guarantee the literally final low on a chart. Classical analysis can identify several LPS areas as a structure develops.
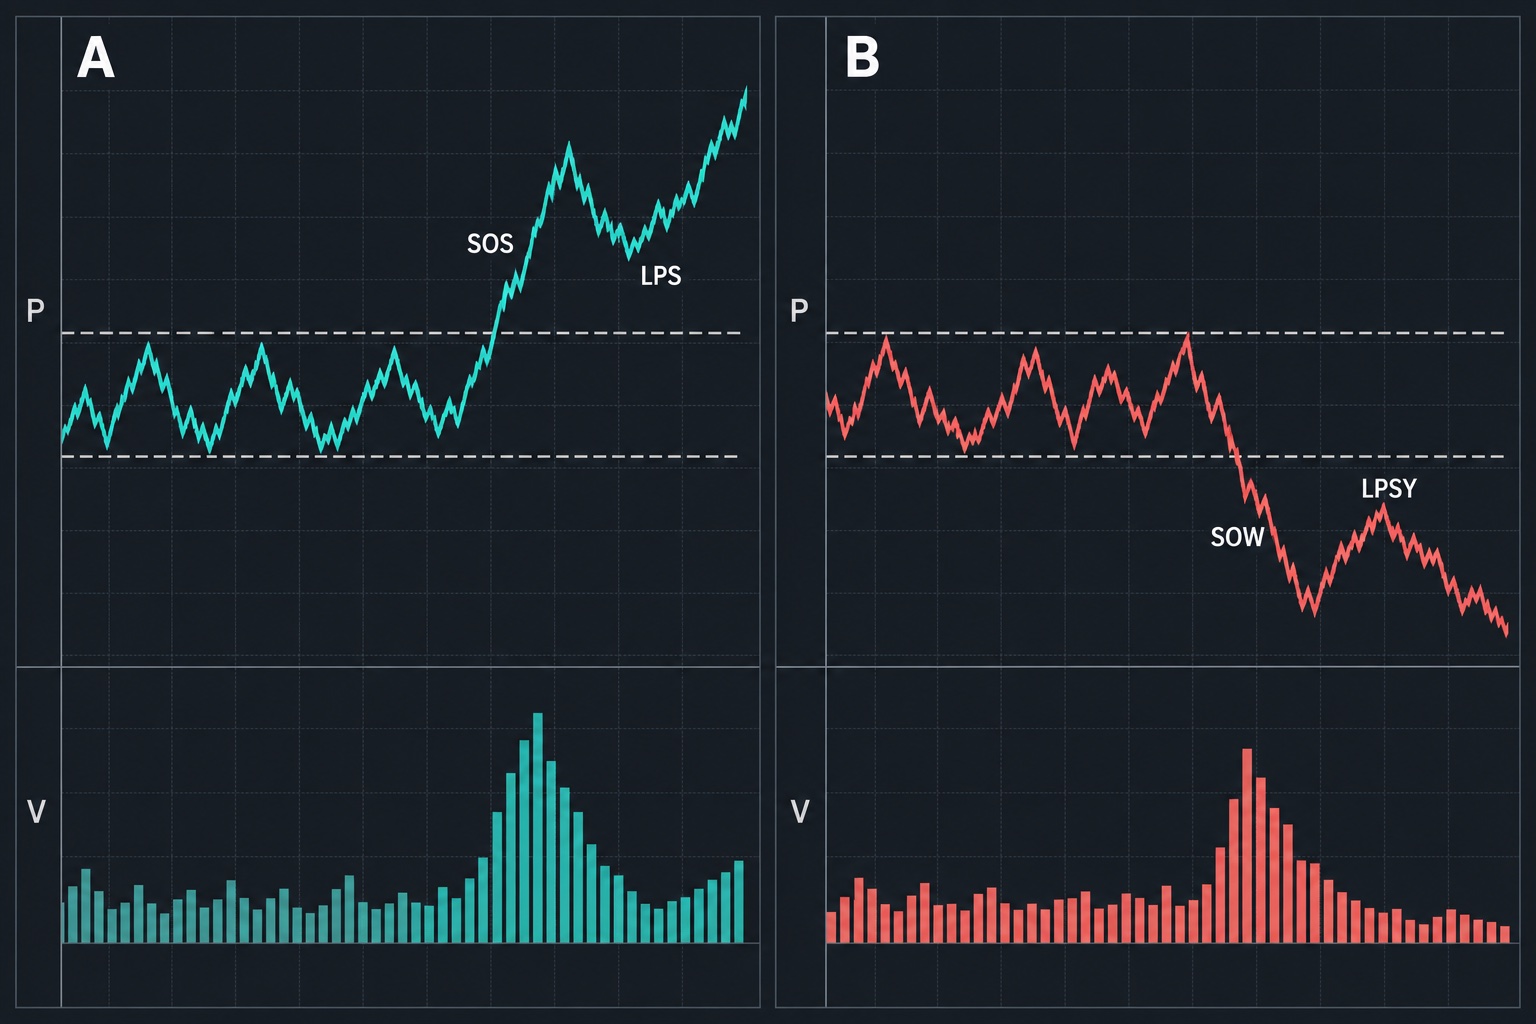
Hypothetical example
A 100–110 range shows SOS toward 114. Price reacts into 110–111 with narrower bars and less activity. The reaction is an LPS candidate.
Former resistance is being tested as possible support. However, LPS need not always coincide exactly with one horizontal price; the structure can also develop within a range.
Evidence against the reading
A reaction fully cancelling the advance and developing below support requires reconsideration. Low volume alone is insufficient: an illiquid market can decline without much turnover.
Without observed strength, the LPS label is premature. Explain which earlier movement constitutes SOS.
LPS and back-up
Back-up describes a test after progress through resistance. It may take several forms and overlap an LPS interpretation. Neither term should become a mandatory one-candle template.
ChartSchool gives classical definitions. Compare LPSY. Describing a reaction does not establish buying profitability.