Heikin Ashi displays transformed prices; a regular candle displays the source series' OHLC for a period. Consequently, the same instrument and timeframe can have different candle colours, closes and extrema. Smoothing helps with a visual assessment of direction, but it does not replace prices at which a trade could have executed.
What is averaged
For a regular candle, Open is the period's opening value, High and Low are its extremes, and Close is the last value. These describe a chosen provider's series: you must separately establish whether it uses trades, quotes or another price.
In the standard Heikin Ashi calculation:
- HA Close = (Open + High + Low + Close) / 4 of the current regular candle.
- HA Open = (HA Open + HA Close) / 2 of the previous Heikin Ashi candle.
- HA High is the maximum of regular High, current HA Open and HA Close.
- HA Low is the minimum of regular Low, current HA Open and HA Close.
The formulas are documented in the official thinkorswim manual. The first bar needs an initial value; when comparing short exports, check that calculations begin in the same way.
One candle can have two colours
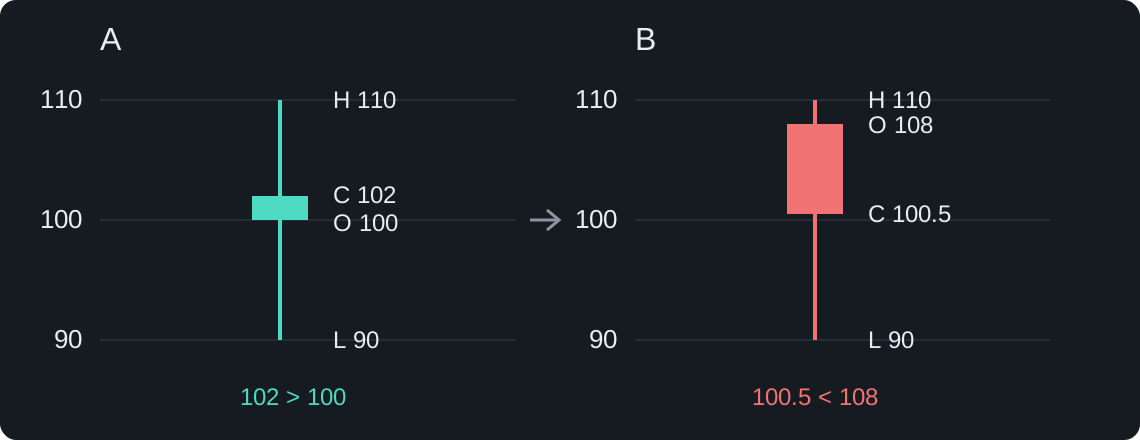
Hypothetical example: regular O = 100, H = 110, L = 90, C = 102. It is green because its close exceeds its open. Suppose the previous HA Open = 106 and HA Close = 110. Current HA Open is then 108, HA Close is 100.5, HA High is 110 and HA Low is 90. The Heikin Ashi candle is red.
There is no contradiction: the opens and closes being compared differ. The value 100.5 is a transformation of four prices, not the last trade price. An actual trade might have matched it, but the formula does not establish that.
Why levels and annotations change
HA Open depends on the preceding transformed bar. The transformation therefore links adjacent candles and smooths changes between bodies. This is a display property, not new information about supply or demand. TradingView explicitly describes Heikin Ashi OHLC as synthetic.
HA High or HA Low can sometimes be set by the transformed open and extend beyond the regular candle's range. Such points cannot simply be used as actual market extremes in a wave count. Similarly, RSI calculated from HA Close and RSI calculated from ordinary Close use different inputs; different divergences need not mean a detector is broken.
Not every indicator automatically switches to HA: some request a separate regular series. Check its documentation rather than infer its input from the chart background.
How to make a fair comparison
First match the instrument, provider, timeframe and candle type. For level prices and execution checks, consult the source series. If HA is used as visual context, distinguish that context from conditions calculated on regular OHLC.
A historical test filling orders at synthetic HA prices may look persuasive while failing to represent market executions. TradingView explains the issue and the option to fill using standard OHLC. Regular OHLC do not guarantee a fill either: spread, liquidity and the path inside the bar still matter.
An open HA candle continues to update with its source candle. Neither smoothing nor a colour change confirms a reversal by itself; see repainting and data availability.