The same ticker does not necessarily mean the same chart. BTC/USDT on two exchanges represents two separate markets, each with its own orders and trades. Last prices, highs, lows and volumes can therefore differ without a data error. Compare a fully specified series rather than the coin's name alone.
Each exchange has its own trades
A last trade price comes from a particular buyer meeting a particular seller. Another venue can execute different orders at the same time. Arbitrage connects markets, but it does not create a single order book or guarantee identical individual trades.
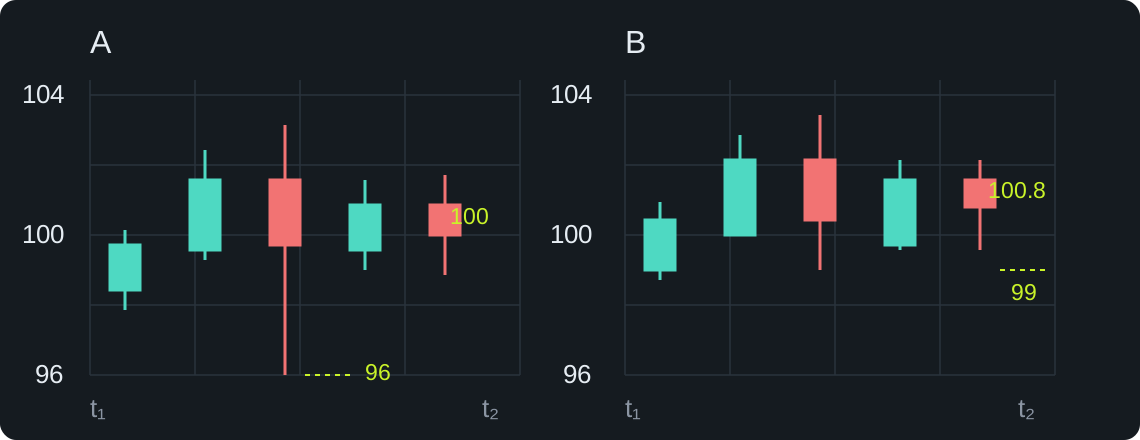
Consider one completed interval. On hypothetical exchange A, the low is 96 and the last price is 100; on B, the low is 99 and the last price is 100.8. A long lower wick on A need not appear on B. This explains a possible difference; it does not validate every unusual wick.
BTC/USD and BTC/USDT are different pairs
One is quoted in dollars, the other in USDT. Their quote assets, participants and liquidity differ. USDT is not a dollar by definition: a close exchange rate does not make the pairs identical.
There are also aggregated indices. TradingView, for example, describes its CRYPTO symbols as calculations using several spot sources. Such a series is not one exchange's trade tape. Spot and perpetual contracts are different instruments too; check Last Price, Mark Price and index price separately.
Candle boundaries matter, not just the 1D label
Two daily candles are comparable when they cover the same time window. Midnight-to-midnight UTC and midnight-to-midnight UTC+8 contain different trades. Their high, low and close can differ even when built from the same underlying trade stream.
Do not confuse this with the time zone displayed on the axis. Translating a timestamp into local time does not by itself rebuild the candles. Check the provider's aggregation rules. Binance, for example, specifies a separate time zone for candle intervals; Kraken describes OHLC for a selected pair and interval.
Why the annotation can change
A different low can lead a person or algorithm to choose a different anchor. The wave count, chart pattern or divergence can then differ. That alone does not establish which interpretation is better: first make the input series comparable.
Comparing a live candle with a completed one is particularly misleading. Its high, low and close are still changing; see repainting and confirmation time.
What to check before calling it an error
- Exchange, exact pair and market type: spot or contract.
- Price series: trades, index or mark price.
- Interval start and end in UTC, and whether the candle is closed.
- Update time, missing data and volume units.
- For a disputed extreme, the original provider's trades for that interval.
If the market, series and boundaries match but completed OHLC still differ, investigate a delay, a provider correction or a loading error. “Different exchanges” is not a substitute for that check. A candle preserves only part of the market information.