Win rate is the fraction of profitable trades in a specified set. It measures frequency, not magnitude. Frequent gains can coexist with a negative total.
Three quantities
Let p be the win fraction, W the average positive result and L the average absolute loss. With no zero outcomes, the mean result before costs is:
E = p × W − (1 − p) × L.
Zero outcomes require their own fraction. Use consistent units and comparable position sizes. With varying capital and compounding, average trade profit is not the account’s compound return.
Many wins, a loss overall
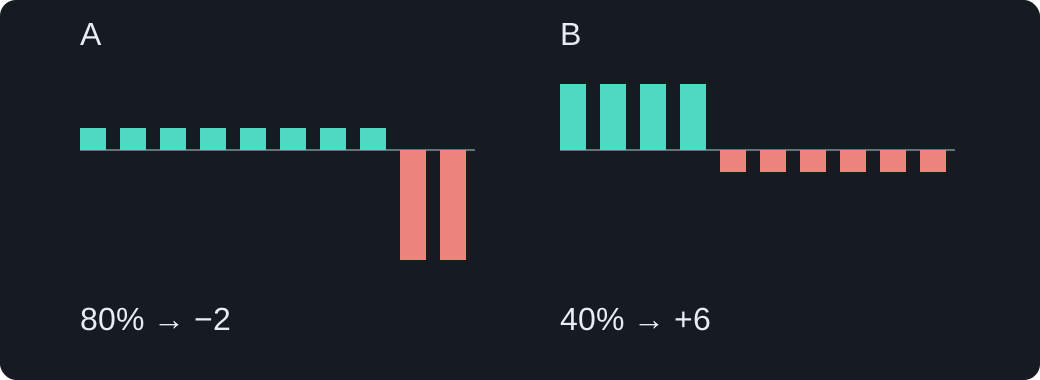
Eight hypothetical trades return +1 each and two return −5 each. The win rate is 80%, but the total is 8 − 10 = −2 and the mean is −0.2 before costs.
A large loss can outweigh many small gains; the win percentage does not reveal this.
Fewer wins, a positive total
Four trades return +3 each and six return −1 each. The win rate is 40%, the total is 12 − 6 = +6 and the mean is +0.6 before costs. This is arithmetic, not evidence that a real strategy achieves these outcomes.
An average cost of 0.2 per trade changes the two means to −0.4 and +0.4 respectively.
Why expectancy is also incomplete
The same mean can accompany different drawdowns, loss sequences and rare-event risks. Report counts, dispersion and conditions. An average does not protect against regime change.
The historical fraction p is not automatically the probability of the next win. Small or dependent samples need particular care.
The formula is a descriptive identity, or an expectation model under stated assumptions. It offers no promise of future profit; execution costs are a separate consideration.