A sample proportion is an observed event frequency. A confidence interval describes uncertainty about a parameter under a specified model. The same frequency can have very different precision.
Both show 70%, but not the same evidence
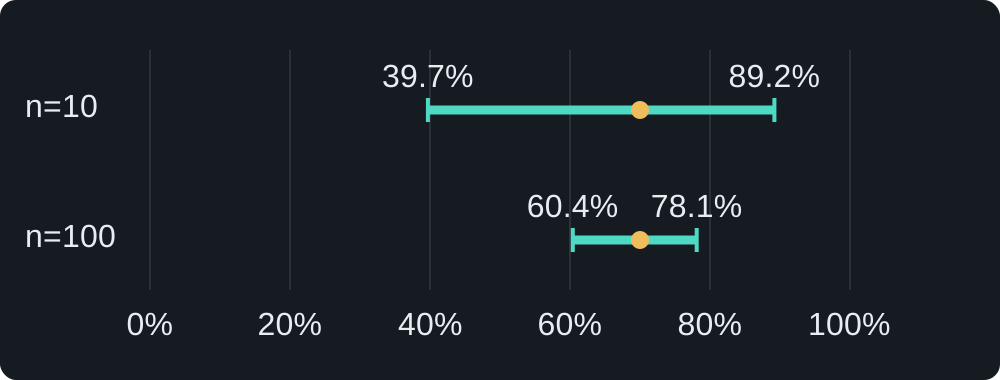
For 7 events out of 10 independent trials, the observed frequency is 70%. A two-sided 95% Wilson interval is approximately 39.7–89.2%.
For 70 events out of 100, the frequency remains 70%, while the interval is approximately 60.4–78.1%. These calculations assume independent trials with a constant event probability. They are educational examples, not market results.
Ten observations do not prohibit every conclusion. They leave substantial uncertainty that a precise-looking percentage should not conceal.
Interpreting 95%
In the frequentist interpretation, the unknown parameter is fixed and interval boundaries vary across samples. Under the assumptions, the procedure is designed for approximately 95% coverage over repeated studies.
This is not a 95% probability that the next trade wins, nor a probability assigned to the fixed parameter after this particular interval has been calculated.
Market cases may not be independent
Overlapping episodes reuse bars; trades may share a trend; probabilities can change across regimes. An independent constant-probability formula can then give false precision.
Justify a dependence model, for example by considering non-overlapping events or an appropriate block-based uncertainty estimate. Removing overlap alone does not prove complete independence.
Report the context
Give the sample size, event definition, period, selection rule, confidence level and calculation method. Frequency uncertainty and dispersion of monetary outcomes are different questions: win frequency does not measure loss size.
NIST describes proportion intervals. Applying them to trading requires justified assumptions and does not convert historical statistics into a forecast.